top of page
Data visualisation
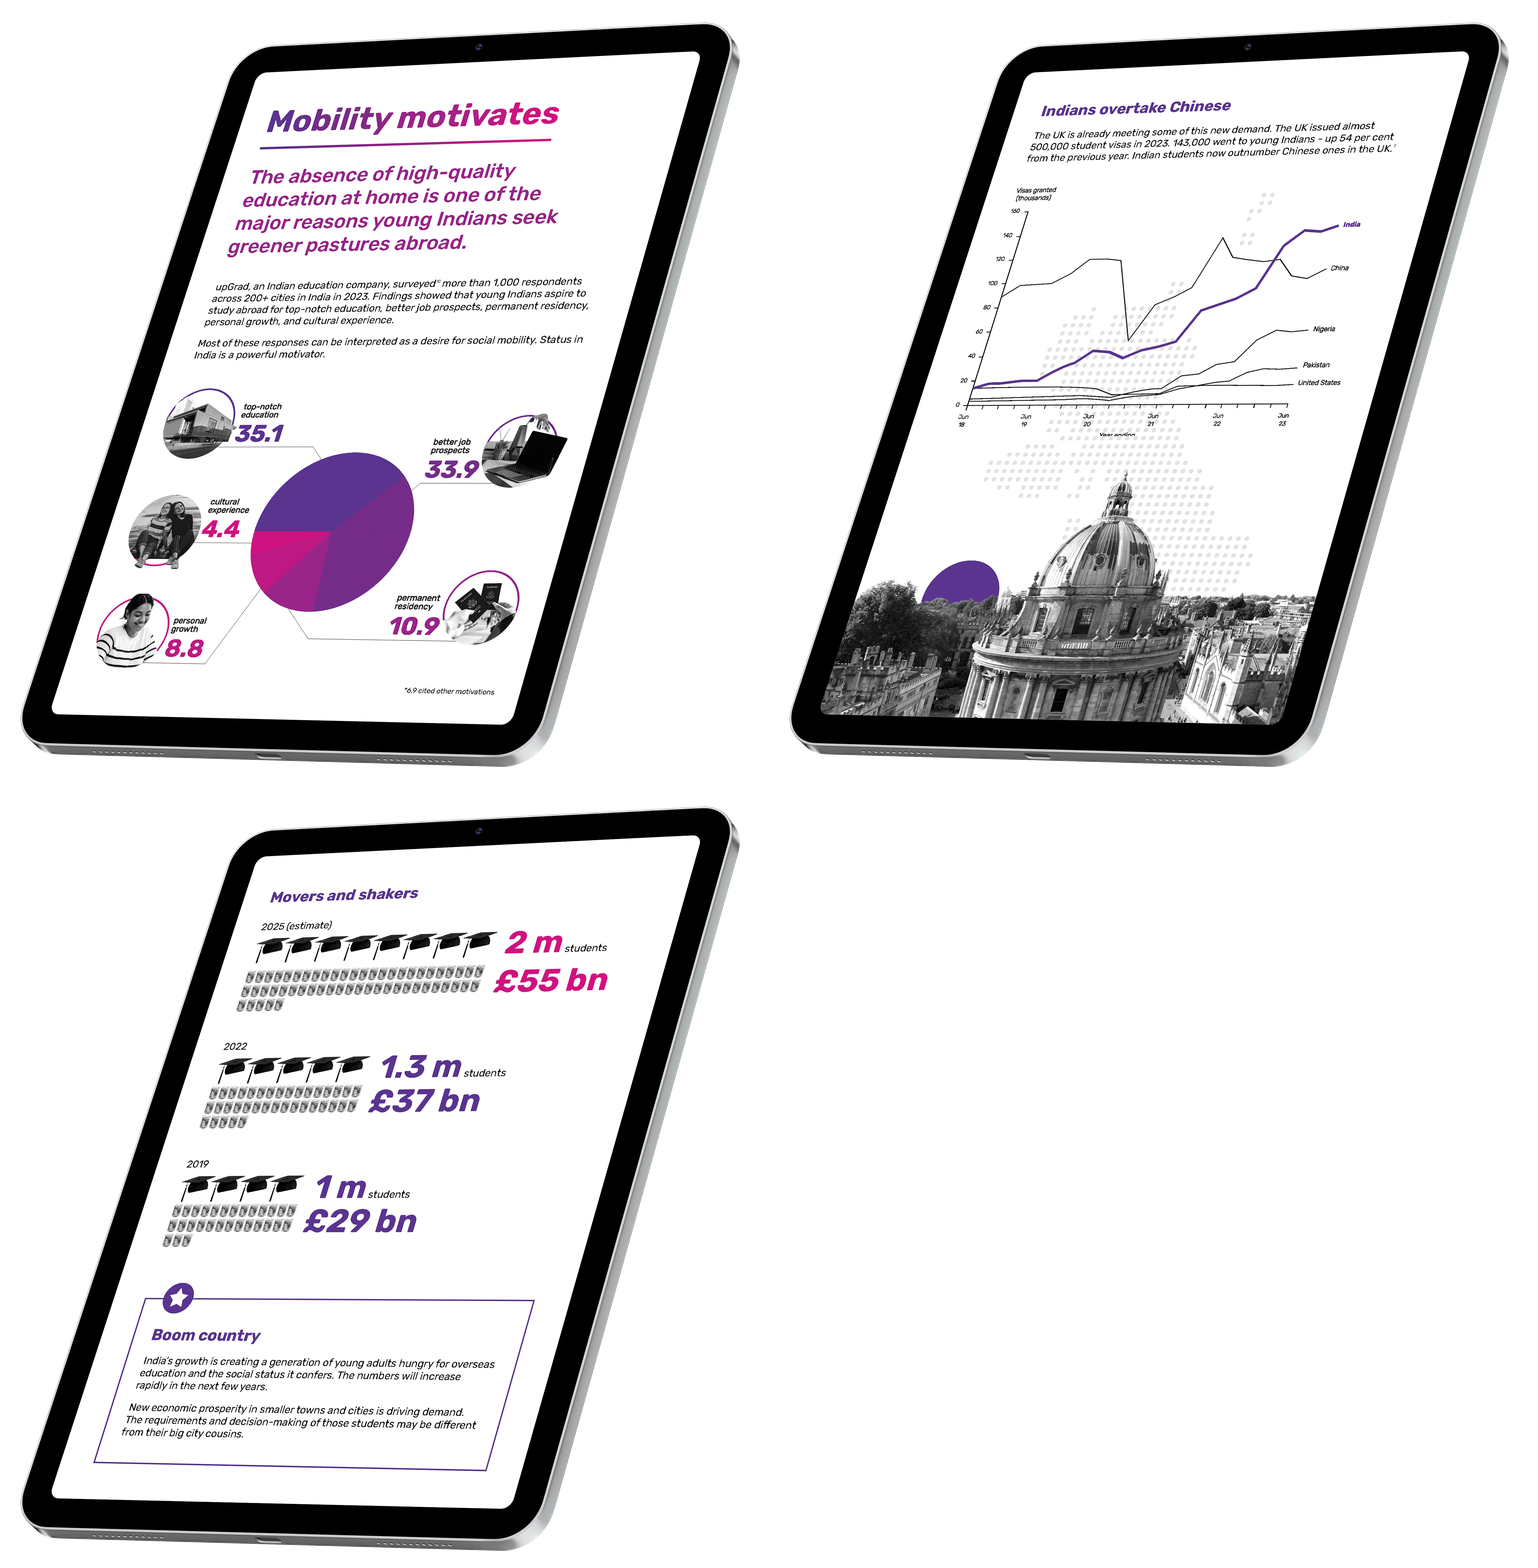
Companies love to tell stories with data. We work with them to bring great data-led stories to life across various media.

We create graphs and charts for annual reports, illustrations for sustainability and marketing campaigns, corporate presentations, and social assets. Our team manages large scale projects which means you can punch above your weight without compromising quality.
Scope includes
-
Conversion of research data into narratives
-
Creation of graphs, charts, and infographics
-
Animations and illustrations in 2D and 3D (Figma/Final Cut Pro/Blender)
-
Production of campaign assets at scale including for social media
-
Report and publications’ design
-
Banks of icons and characters


bottom of page
